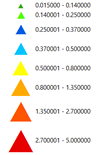

Mercury Contamination in the Edwards Aquifer: 1971-2006This animation shows instances where mercury was detected in samples of water taken from Edwards Aquifer test wells. The animation begins with several detections in 1971 and the detections accumulate as the time line progresses through the years, ending in 2006. White outlines are counties. From left to right they are: Uvalde, Medina, Bexar, Comal, Hays. Light blue outline is Edwards Aquifer Recharge Zone.
|
||||
